Analytics Page
The Analytics page gives you a detailed view of how Alcemi is performing in your store. Use it to measure the agent’s impact on sales, understand customer behavior, and identify opportunities to improve.
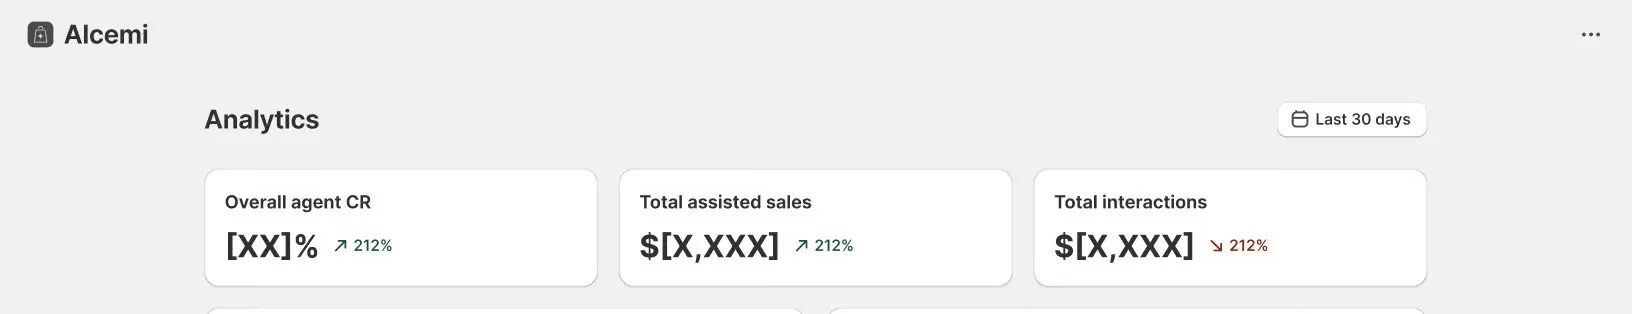
At the top of the page, you’ll see three headline metrics:
- Overall Agent Conversion Rate — the percentage of conversations that resulted in a purchase.
- Total Assisted Sales — the total number of sales influenced by Alcemi.
- Total Interactions — the number of customer conversations handled by the AI.
Use the timeframe selector (last 7 days, 30 days, 1 year, custom) to adjust results.
Key Metrics
Section titled “Key Metrics”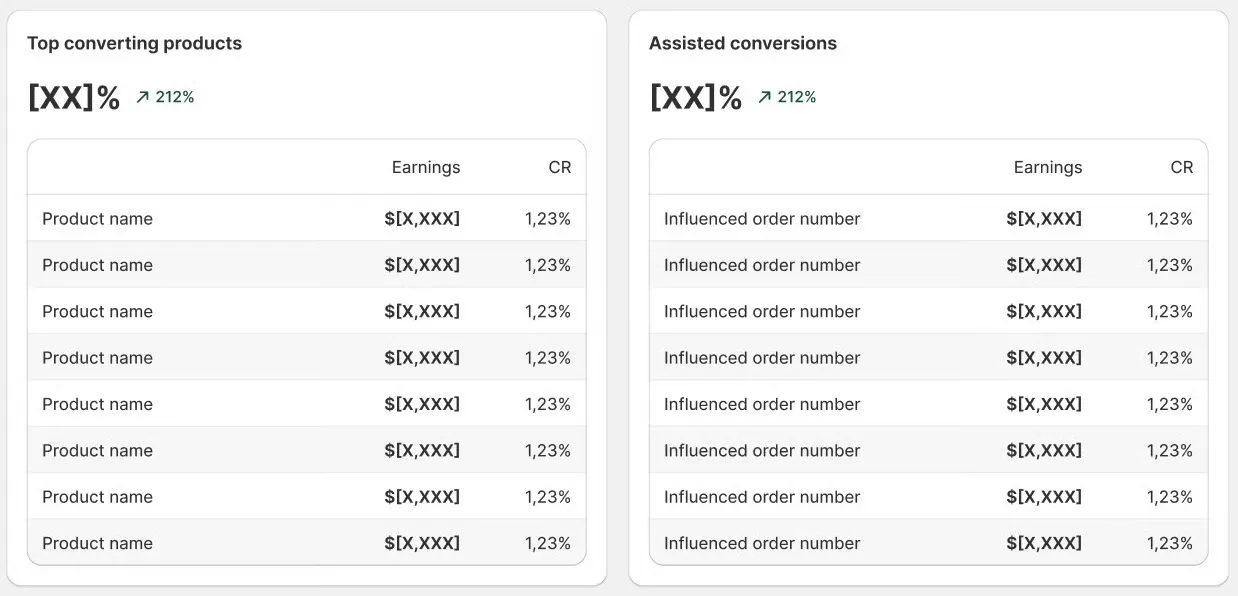
- Top Converting Products — see which products have the highest conversion rates when assisted by Alcemi.
- Assisted Conversions — view orders influenced by Alcemi, including order number and order value.
Conversion Insights & Customer Behavior
Section titled “Conversion Insights & Customer Behavior”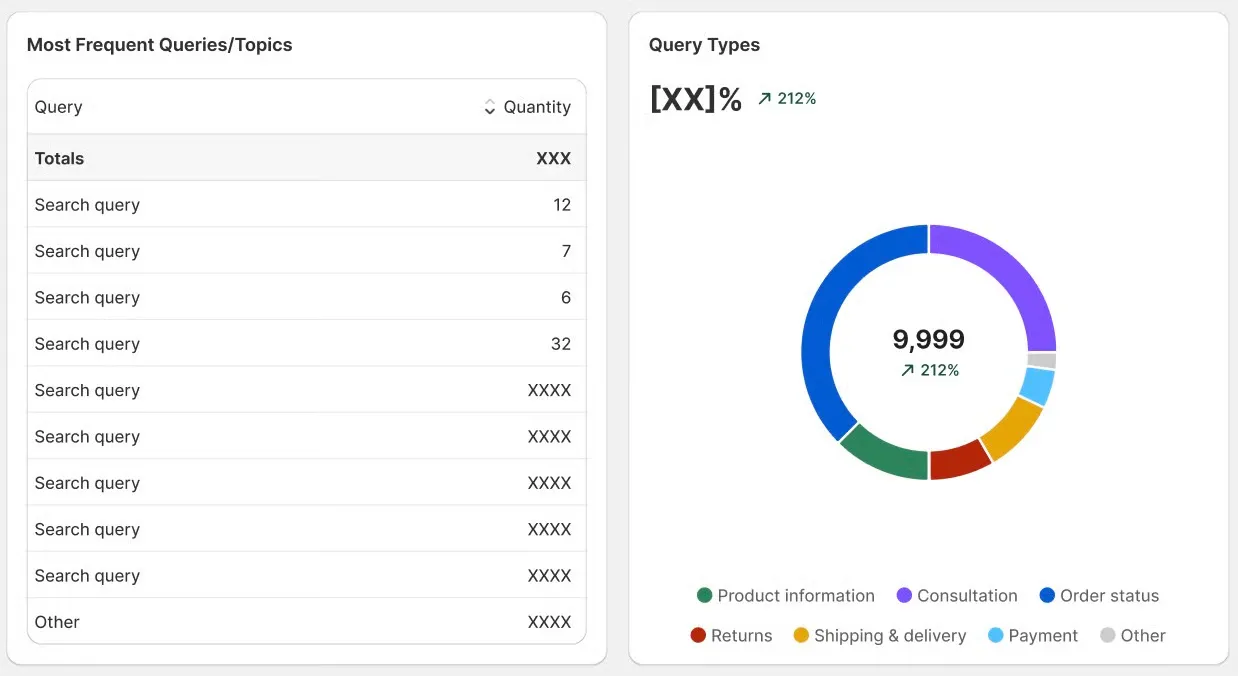
- Most Frequent Queries & Topics — breakdown of what customers are asking most often, with counts of how many times each query type occurred.
- Query Types (%) — a percentage distribution of interaction types (e.g., product information, consultation, policy questions) displayed in a pie chart.
How to Use Analytics
Section titled “How to Use Analytics”- Identify best-selling products influenced by Alcemi and feature them in promotions.
- Spot customer pain points by reviewing frequent queries.
- Track ROI by monitoring assisted conversions and revenue trends.